Business Intelligence
Combination of technologies like
Data Warehousing (DW)
On-Line Analytical Processing (OLAP)
Data Mining (DM)
Data Visualization (VIS)
Decision Analysis (what-if)
Customer Relationship Management (CRM)
Operational Data
Presents a dynamic view of the business
Must be kept up-to-date and current at all times
Updated by transactions entered by data-entry operators or specially trained end users Is maintained in detail
Utilization is predictable. Systems can be optimized for projected workloads
High volume of transactions, each of which affects a small portion of the data
Users do not need to understand data structures
Functional orientation
Analytical Data
Presents a static view of the business
End-user access is usually read-only
More concerned with summary information
Usage is unpredictable in terms of depth of information needed by the user
Smaller number of queries, each of which may access large amounts of data
Users need to understand the structure of the data (and business rules) to draw meaningful conclusions from the data
Subject -orientation
Database
Broadly classified into
OLTP (Online Transactional Processing) DB
OLAP (Online Analytical Processing) DB
OLAP
Slicing and dicing of data is called as Online Analytical Processing (OLAP). OLAP only serves the needs of data warehousing than OLTP.
OLAP systems allow ad hoc processing and support access to data over time periods.
OLAP systems are the aggregation, transformation, integration and historical collection of OLTP data from one or more systems.
Typical OLAP operations:
Roll up (drill up)
Drill down(roll down)
Slice and dice
Pivot (rotate)
OLAP vs OLTP
Slno
|
OLTP
|
OLAP
|
1.
|
Transaction Oriented
|
Decision Oriented (Reports)
|
2.
|
Complex data model (fully normalized)
|
Simple data model
(multidimensional/de-normalized)
|
3.
|
Smaller data volume (few historical data)
|
Larger data volumes (collection of historical data)
|
4.
|
Many, ”small” queries
|
Fewer, but ”bigger” queries
|
5.
|
Frequent updates
|
Frequent reads, in-frequent updates (daily)
|
6.
|
Huge no. of users(clerks).
|
Only few users(Management Personnel)
|
Objective of Data Warehouse
The primary purpose of a data warehouse is to provide easy access to specially prepared data that can be used with decision support applications, such as management reporting, queries, decision support systems, and executive information systems.
Decision Support
A Decision Support System (DSS) is a system that provides managers with information they need to make decisions. These systems have the effect of empowering employees at all levels, providing them access to business and financial information that directly impact their productivity and quality of work
Executive information systems
An Executive information system (EIS) is a concise snapshot of how the company is doing today. Consider it as an electronic executive briefing. EIS allows greater flexibility in “slicing-and-dicing” data, i.e.; it allows exploration of data through multiple dimensions or views.
Why Datawarehouse?
By centralizing data
The queries can be answered locally without accessing the original information sources. Thus, high query performance can be obtained for complex aggregation queries that are needed for in-depth analysis, decision support and data mining – a way of extracting relevant data from a vast database.
On-line Analytical Processing (OLAP) is decoupled (separated) as much as possible from On-line Transaction Processing (OLTP). Thus making information accessible to decision makers avoiding interference of OLAP with local processing at the operational sources.
Data warehouse
data in support of management’s decision making process.
- W. H. Inmon, 1993
*Subject Oriented - Data warehouses focuses on high-level business entities like sales,marketing,etc.
*Integrated - Data in the warehouse is obtained from multiple sources and kept in a consistent format.
*Time-Varying - Every data component in the date warehouse associates itself with some point of time like weekly,monthly,quarterly, yearly
*Non-volatile - Dw stores historical data. Data does not change once it gets into the warehouse. Only load/refresh.
Data from the operational systems are
Extracted
Cleansed
Transformed
case conversion,
data trimming,
concatenation,
datatype conversion
Use of DWH
Ad-hoc analyses and reports
Data mining: identification of trends
Management Information Systems
Designing a database for a Data Warehouse
Define User requirements, considering different views of users from different departments.
Identify data integrity, synchronization and security issues/bottlenecks.
Identify technology, performance, availability & utilization requirements.
Review normalized view of relational data to identify entities.
Identify dimensions.
Create and organize hierarchies of dimensions.
Identify attributes of dimensions.
Identify fact table(s).
Create data repository (metadata).
10.Add calculations.
Datamart
Datamart is a subset of data warehouse and it is designed for a particular line of business, such as sales, marketing, or finance.
In a dependent data mart, data can be derived from an enterprise-wide data warehouse.
In an independent data mart, data can be collected directly from sources
May be structured for specific access tools Datamart is the data warehouse you really use Why Datamart?
Datawarehouse projects are very expensive and time taking.
Success rate of DWH projects is very less
To avoid single point of loss we identify department wise needs and build Datamart. If succeeded we go for other departments and integrate all datamarts into a Datawarehouse.
Improve data access performance
Simplify end-user data structures
Facilitate ad hoc reporting
Slno
|
Data warehouse
|
Data mart
|
|
1.
|
DW Operates on an enterprise level and contains all data used for reporting and analysis
|
Data Mart is used by a specific business department and is focused on a specific subject (business area).
|
|
|
|
|
DM is a subset of DWH
|
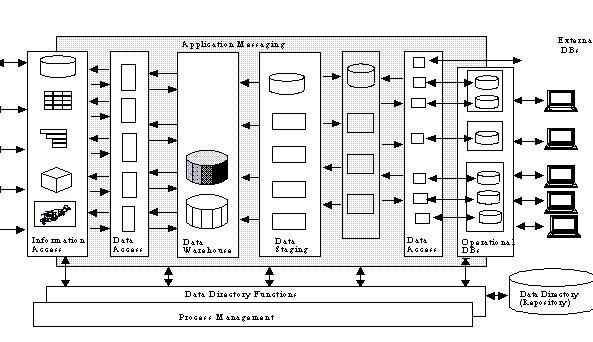
DWH ARCHITECHTURE
Data warehouse architecture is a way of representing the overall structure of data, communication, processing and presentation that is planned, for end-user computing within the enterprise. The architecture has the following main parts:
Operational data base
Information access layer
Data Access layer
Data dictionary (metadata) layer
Process management layer
Application messaging layer
Processing (Data Warehouse) layer
Data Staging layer
Operational data is the information related to day-to-day functioning of an organization. An operational database stores business transactions critical to the functioning of the organization.
Information access layer is the layer that the end-user deals with directly. Examples of these are ad-hoc query tools like Business Objects, Power Play and Impromptu.
Data access layer is the data interchange layer. This layer provides interface between operational data bases and information access layers. The common data language used is ‘SQL’. A familiar example of a data access layer is ‘ODBC’.
Metadata layer holds a repository of Metadata information. Metadata is defined as data about data, resulting in an intelligent, efficient way to manage data. Metadata provides the structure and content of the data warehouse, source and mapping information, transformation / integration description and business rules. It is essential for quality improvement in a Data Warehouse.
Process management layer is involved in scheduling the various tasks that must be executed to build and maintain the data warehouse and data repository. It also helps to keep the Data Warehouse up-to-date.
Application messaging layer transports information around the enterprises’ computing network. It also acts as ‘middle-ware’ and isolates applications from exact data format on either end.
Processing (data warehouse) layer is the logical view of the informational data. It also performs the summarization, loading and processing of data from operational databases.
Data staging layer manages data replication across servers. It also manages data transformation.
ETL
ETL means Extraction, transformation, and loading.
ETL refers to the methods involved in accessing and manipulating source data and loading it into target database.
ETL Process
Etl is a process that involves the following tasks:
extracting data from source operational or archive systems which are the primary source of data for the data warehouse
transforming the data - which may involve cleaning, filtering, validating and applying business rules
loading the data into a data warehouse or any other database or application that houses data
Transform
Denormalize data
Data cleaning.
Case conversion
Data trimming
String concatenation
datatype conversion
Decoding
calculation 9. Data correction.
Cleansing
The process of resolving inconsistencies and fixing the anomalies in source data, typically as part of the ETL process.
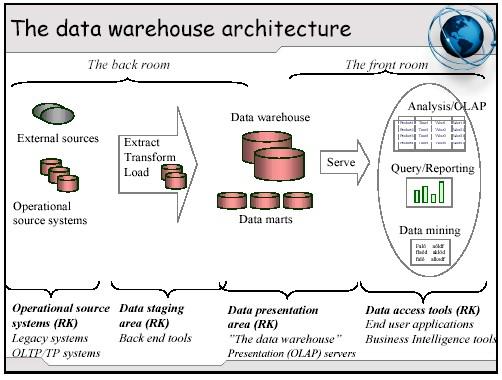
Data Staging Area
Most complex part in the architecture.
A place where data is processed before entering the warehouse
It involves...
Extraction (E)
Transformation (T)
Load (L)
Indexing
Popular ETL Tools
Tool Name
|
Company Name
|
Informatica
|
Informatica Corporation
|
DT/Studio
|
Embarcadero Technologies
|
DataStage
|
IBM
|
Ab Initio
|
Ab Initio Software Corporation
|
Data Junction
|
Pervasive Software
|
Oracle Warehouse Builder
|
Oracle Corporation
|
Microsoft SQL Server Integration
|
Microsoft
|
TransformOnDemand
|
Solonde
|
Transformation Manager
|
ETL Solutions
|
Dimensional Modeling
Dimension table
Dimension table gives the descriptive attributes of a business.
They are fully denormalized
It has a primary key
Data arranged in hierarchical manner (product to category; month to year) – if so we can use for drill down and drill up analysis
Has less no. of records
Has rich no. of columns
Heavily indexed
Dimension tables are sometimes called lookup or reference tables.
Types of Dimensions
Normal Dimension
Confirmed Dimension
Junk Dimension
Degenerated Dimension
Role Playing Dimension
Confirmed Dimension
Dimension table used by more than one fact table is called Confirmed Dimensions
(dimensions that are linked to multiple fact tables)
D1 D2 D1 D2 D5
D3 
Adv:
To avoid unnecessary space
Reduce time
Drill across fact table
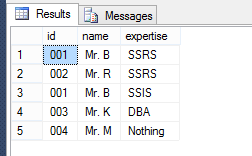
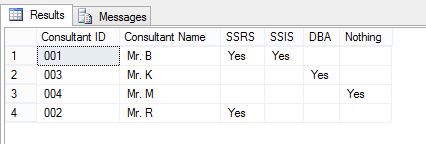
Junk Dimension
is an abstract dimension it will remove number of foreign keys from fact table. This is achieved by combining 2 or more dimensions into a single dimension.
Degenerated Dimension
Means a key value or dimension table which does not have descriptive attributes. i.e.) a non foreign key and non numerical measure column used for grouping purpose
Ex : Invoice Number, Ticket Number
Role Playing Dimension
Means a single physical dimension table plays different role with the help of views.
Fact Table
1. The centralized table in a star schema is called as FACT table 2. A fact table typically has two types of columns:
The primary key of a fact table is usually a composite key that is made up of all of its foreign keys
Fact tables store different types of measures like
additive,
non additive and
semi additive measures
A fact table might contain either detail level facts or facts that have been aggregated
A fact table usually contains facts with the same level of aggregation.
Has millions of records
Measure Types
Additive - Measures that can be summarized across all dimensions. o Ex: sales
Non Additive - Measures that cannot be summarized across all dimensions. o Ex: averages
Semi Additive - Measures that can be summarized across few dimensions and not with others.
o Ex: inventory levels
Factless Fact
A fact table that contains no measures or facts is called as Factless Fact table.
Slowly Changing Dimensions
Dimensions that change over time are called Slowly Changing Dimensions
Slowly Changing Dimensions are often categorized into three types namely
Type 1 SCD :
Product Price in 2004:
Product ID(PK)
|
Year
|
Product Name
|
Product Price
|
1
|
2004
|
Product1
|
$150
|
Product Price in 2005:
Product ID(PK)
|
Year
|
Product Name
|
Product Price
|
1
|
2005
|
Product1
|
$250
|
Type 2 SCD:
If history and current value needed
Creating another additional record.(new record with new changes and new surrogate key)
Mostly preferred in dimensional modeling
Product
Product ID(PK)
|
Effective
DateTime(PK)
|
Year
|
Product
Name
|
Product Price
|
Expiry DateTime
|
1
|
01-01-2004
12.00AM
|
2004
|
Product1
|
$150
|
12-31-2004
11.59PM
|
1
|
01-01-2005
12.00AM
|
2005
|
Product1
|
$250
|
|
Type 3 SCD:
Product ID(PK)
|
Current Year
|
Product Name
|
Current Product Price
|
Old Product Price
|
Old Year
|
1
|
2005
|
Product1
|
$250
|
$150
|
2004
|
Surrogate keys
Surrogate keys are always numeric and unique on a table level which makes it easy to distinguish and track values changed over time.
Surrogate keys are integers that are assigned sequentially as needed to populate a dimension.
Surrogate keys merely serve to join dimensional tables to the fact table.
Surrogate keys are beneficial as the following reasons:
Reduces space used by fact table
Faster retrieval of data ( since alphanumerical retrieval is costlier than numerical data)
Maintaining index is easier with numeric key.
Maintain all slowly changing dimenion.
Data warehouse Design
The data warehouse design essentially consists of four steps, which are as follows:
Identifying facts and dimensions
Designing fact tables
Designing dimension tables
Designing database schemas
Types of database schemas
There are three main types of database schemas:
1. Star Schema, 2. Snowflake Schema and
3. Starflake schema.
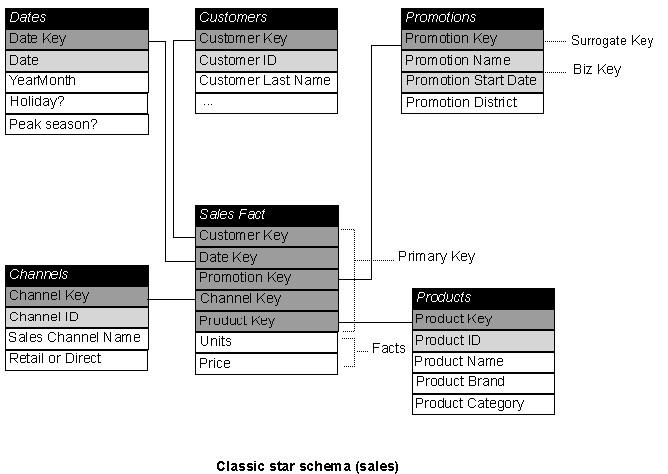
Star Schema
It is the simplest form of data warehouse schema that contains one or more dimensions and fact tables
It is called a star schema because the entity-relationship diagram between dimensions and fact tables resembles a star where one fact table is connected to multiple dimensions
The center of the star schema consists of a large fact table and it points towards the dimension tables
Fact Table = Highly Normalized Dimension Table = Highly denormalized.
It can be very effective to treat fact data as primarily read-only data, and dimensional data as data that will change over a period of time
Advantages:
Star schema is easy to define.
It reduces the number of physical joins.
Provides very simple metadata.
Drawbacks:
Steps in designing Star Schema
Identify a business process for analysis (like sales).
Identify measures or facts (sales dollar).
Identify dimensions for facts (product dimension, location dimension, time dimension, organization dimension).
List the columns that describe each dimension. (Region name, branch name, employee name).
Determine the lowest level of summary in a fact table (sales dollar).
Fact constellation:
Dimension tables will, in turn, have their own dimension tables. In this case, the Store dimension will contain District ids and Region ids, which will reference district and region dimensions of Store dimension, respectively. This Schema is called Fact Constellation Schema.
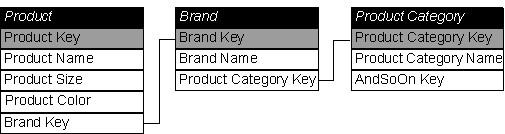
Snowflake schema
A snowflake schema is a term that describes a star schema structure normalized through the use of outrigger tables. i.e dimension table hierarchies are broken into simpler tables
Represent dimensional hierarchy directly by normalizing the dimension tables ie) all dimensional information is stored in third normal form
This implies dividing the dimension tables into more tables, thus avoiding nonkey attributes to be dependent on each other.
Advantages:
Disadvantages:
More joins will be needed
Snowflake Schema
Starflake Schema
1. combinations of denormalized Star and normalized Snowflake schemas.
Star Schema vs Snowflake Schema
Slno
|
Star Schema
|
Snow Flake
|
1.
|
Dimension table will not have any parent table
|
Dimension table will have one or more parent tables
|
2.
|
Hierarchies for the dimensions are stored in the dimensional table itself
|
Hierarchies are broken into separate tables in snow flake schema
|
Granularity
Transactional Level Granularity
Mostly used
Each and every transaction stored in fact table
Drill down and drill up analysis can be done
Disadvantage 1. Size increases.
Periodic Snapshot Granularity
Summarizing data over a period is stored in fact table
Adv : Faster retrieval (less records)
Disadv : Detail information not available
FAQ
Hierarchy
Hierarchies are logical structures that use ordered levels as a means of organizing data.
A hierarchy can be used to define data aggregation.
Example
Level
A position in a hierarchy. For example, a time dimension might have a hierarchy that represents data at the Month, Quarter, and Year levels.
Operational Data Store
In recent times, OLAP functionality is being built into OLTP systems which is called ODS (operational data store).
A physical set of tables sitting between the operational systems and the data warehouse or a specially administered hot partition of the data warehouse itself.
The main reason of ODS is to provide immediate reporting of operational results if neither the operational system nor the regular data warehouse can provide satisfactory accsee.
Since an ODS is necessarily an extract of the operational data, it also may play the role of source for data warehouse.
Data Staging Area
A storage area that clean, transform, combine, duplicate and prepare source data for use in the data warehouse.
The data staging area is everything in between the source system and data presentation server.
No querying should be done in the data staging area because the data staging area normally is not set up to handle fine-grained security, indexing or aggregation for performance.
Data Warehouse Bus Matrix
The matrix helps prioritize which dimensions should be tackled first for conformity given their prominent roles.
The matrix allows us to communicate effectively within and across data mart teams.
The columns of the matrix represent the common dimensions.
The rows identify the organizations business processes.
Degenerated Dimension
Operational control numbers such as invoice numbers, order numbers and bill of lading numbers looks like dimension key in a fact table but do not join to any actual dimension table. They give rise to empty dimension hence we refer them as Degenerated Dimension(DD).